Consumer research · Data collection
Consumer research built on what people actually choose.
Statwren publishes consumer research built on large-scale data collection: the saves, votes, thumbs-downs and poll answers that readers of our consumer publications leave as they browse. Not a panel asked to imagine what they might buy. Real choices, scored, with the confidence intervals left in.
Latest reports
Reports you can act on this week
Each report answers one commercial question, shows the evidence, and ships with the full dataset so your analysts can check every number.
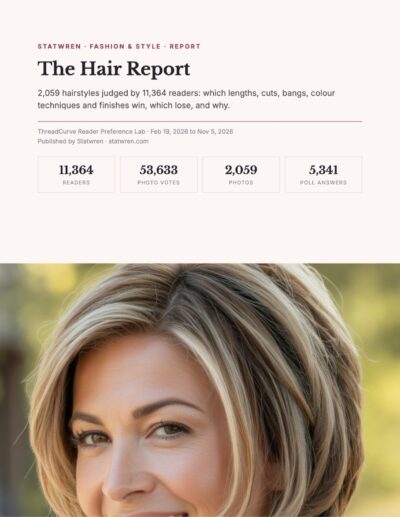
The Hair Report: 2,059 Hairstyle Photos Judged by 11,364 Readers
11,364 readers cast 53,633 votes on 2,059 hairstyles, plus 5,341 poll answers: which lengths, cuts, bangs and colour techniques win, which lose, and why.
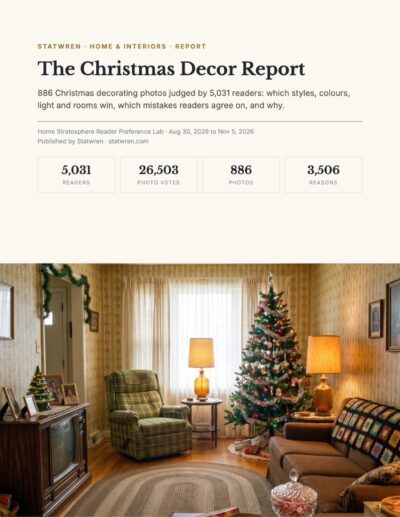
The Christmas Decor Report: 886 Holiday Decorating Photos Judged by 5,031 Readers
5,031 readers cast 26,503 votes on 886 Christmas decorating photos: which styles, colours, light and rooms win, which mistakes readers agree on, and why.
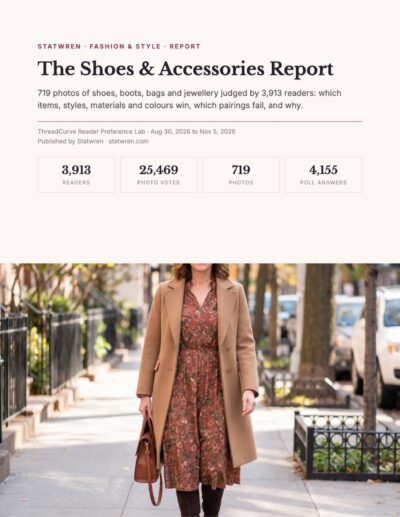
The Shoes & Accessories Report: 719 Shoes, Bags and Jewellery Looks Judged by 3,913 Readers
3,913 readers cast 25,469 votes on 719 photos of shoes, boots, bags and jewellery, plus 4,155 poll answers: which items, styles, materials and colours win, which pairings fail, and why.
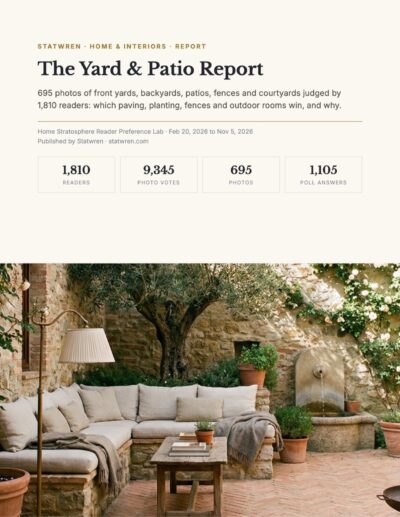
The Yard & Patio Report: 695 Front Yards, Backyards and Patios Judged by 1,810 Readers
1,810 readers cast 9,345 votes on 695 photos of front yards, backyards, patios, fences and courtyards, plus 1,105 poll answers: which paving, planting, fences and outdoor rooms win, and why.
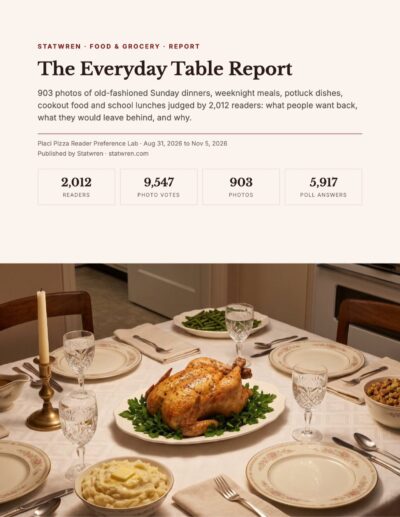
The Everyday Table Report: 903 Photos of Old-Fashioned Dinners, Lunches and Potlucks, Judged
2,012 readers cast 9,547 votes on 903 photos of old-fashioned Sunday dinners, weeknight meals, potluck dishes, cookout food and school lunches, plus 5,917 poll answers: what people want back, what they would leave behind, and why.

The Classic Car Report: 431 Car Models Ranked by 1,526 Readers
1,526 readers cast 6,717 votes on 431 car models and 1,324 photos of classic cars, details and car culture, plus 1,823 poll answers: which eras, body styles and origins win, which lose, and why.
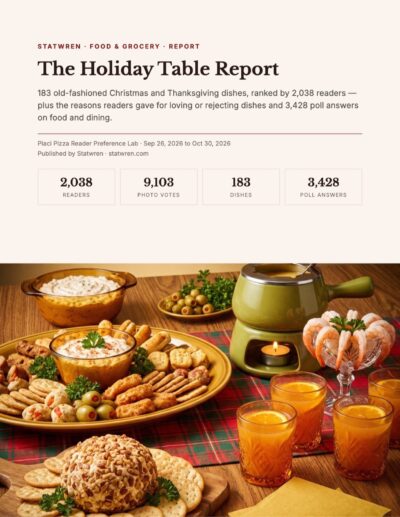
The Holiday Table Report: 183 Old-Fashioned Christmas and Thanksgiving Dishes, Ranked
2,038 readers cast 9,103 votes on 183 vintage holiday dishes, plus 3,428 poll answers: what people want back on the holiday table, what they would leave in the past, and why.
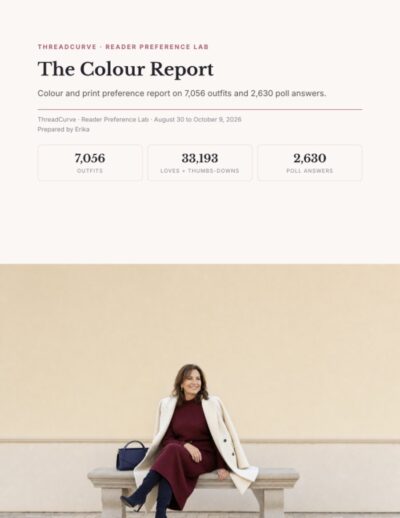
The Colour Report: Which Colours and Prints Readers Reward
7,056 outfits and about 4 million views: burgundy is the only main colour that stays clearly above average once each outfit is compared fairly. White loses. Plus the best pairings and prints.
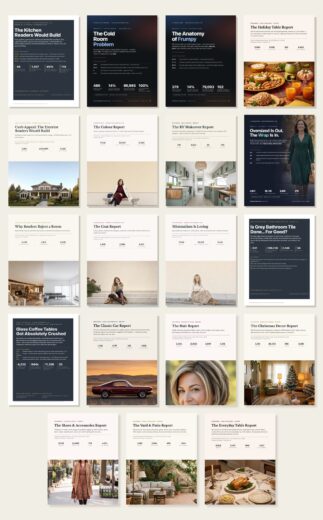
Complete Library: All Statwren Reports
Every Statwren report: eight home, seven fashion, two food, one RV and one car report, 522 pages, every dataset. Save US$1,622.
Why it is different
Behaviour first, then what people say
Signals, not recall
Surveys ask people to predict their own taste. We record what readers do when nobody is asking: what they save, what they thumb down, which of two images they pick.
Say versus do
Where we run polls, we check the answer against behaviour on the same topic. When the two disagree, the gap is usually the most valuable finding in the report.
Honest about the limits
Every index carries a 95% interval and a reporting threshold. Every report states who the panel is and what it cannot tell you. Findings that fall apart under a fair comparison are shown falling apart.
Coverage
Industries
Two categories are live. The panel already collects signals in the rest, and reports will follow as sample sizes clear our reporting thresholds.
Custom research
Need an answer we have not published?
We can put your question in front of the panel: a poll series, a head-to-head image test or a tagged-image study on your category. You get a private report and the data.