Glass Coffee Tables Got Crushed: Coffee Table Preference Index
Report · 12-page PDF + 3 CSVs
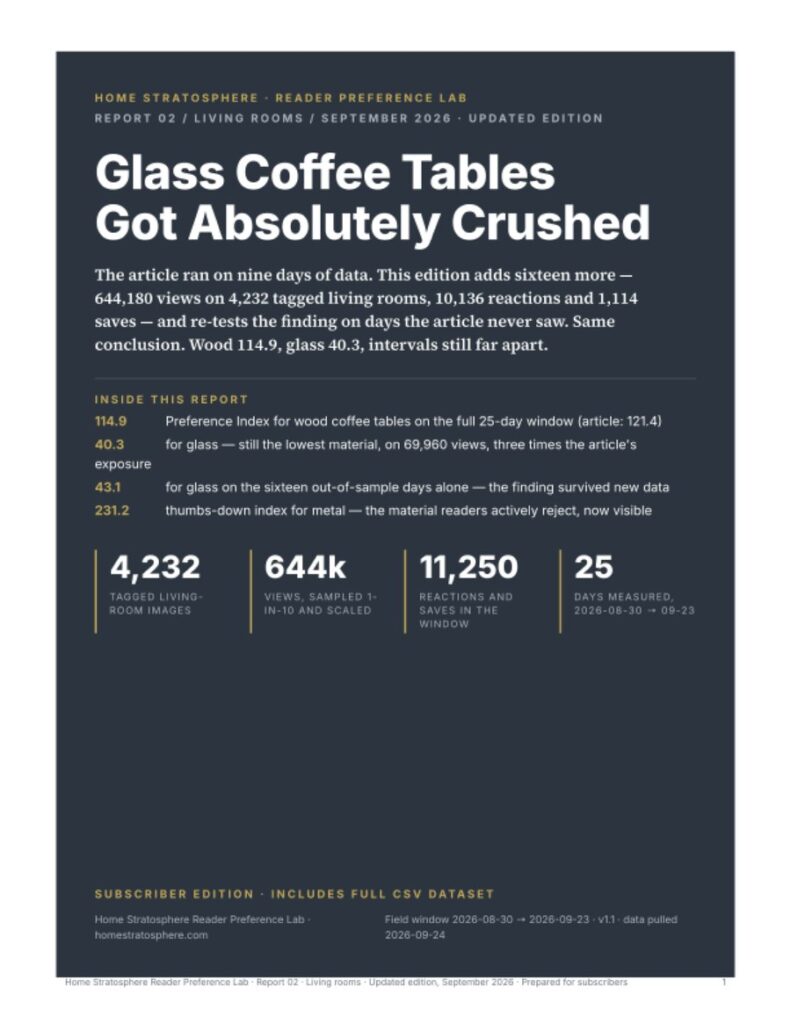
644,180 views of 4,232 living rooms: wood coffee tables index 114.9, glass 40.3, and the finding held on 16 days of new data.
- Instant download after checkout
- Licensed for use across your company
- Every figure reproducible from the data
644kphoto views
4,232living rooms tagged
11,250reactions + saves
25days measured
A focused report on one finding: how readers respond to coffee tables by material. Wood leads, glass trails badly, and metal is the material readers actively reject. The finding is re-tested on sixteen days the original analysis never saw.
Key findings
- 114.9 Preference Index for wood coffee tables (95% interval 110.9 to 118.9).
- 40.3 for glass, the lowest material, on 69,960 views.
- 43.1 for glass on the out-of-sample days alone: the finding survived new data.
- 231.2 thumbs-down index for metal, the material readers reject outright.
What’s inside
- 12-page PDF report, 10 sections
- All five coffee table materials ranked with intervals
- Approval, rejection and saves as separate signals
- Audience breakdown by age band
- Dataset: 3 CSV files including all 4,232 tagged living-room images
Sample and method
| Panel | Readers of homestratosphere.com, a US home-design publication |
|---|---|
| Field window | Aug 30 to Sep 23, 2026 |
| Signals | 10,136 emoji reactions and 1,114 saves |
| Format | PDF + CSV, instant download |
Views are sampled 1-in-10 and scaled. Association, not causation: the report discusses the room around the table and the photography question.
Who uses this
Furniture brands and retailers, living-room designers, product photographers, home journalists.