Consumer preference data
What people actually choose, measured.
Statwren reports are built from real behaviour: the saves, votes, thumbs-downs and poll answers that readers of our consumer publications leave as they browse. Not a panel asked to imagine what they might buy. Real choices, scored, with the confidence intervals left in.
Latest reports
Reports you can act on this week
Each report answers one commercial question, shows the evidence, and ships with the full dataset so your analysts can check every number.
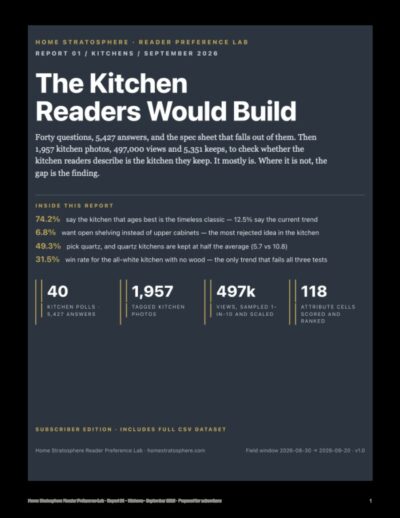
The Kitchen Readers Would Build: Kitchen Preference Report 2026
40 kitchen polls, 5,427 answers and 497,000 photo views: the spec sheet homeowners describe, and whether it matches the kitchens they actually save.
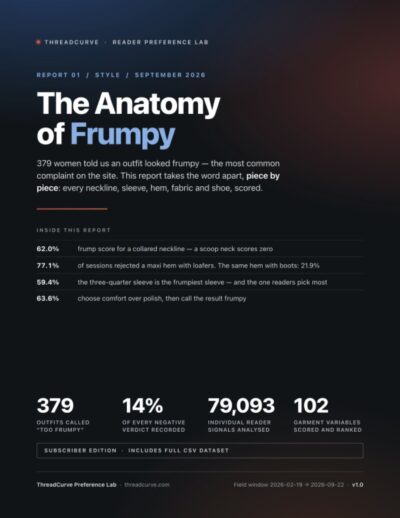
The Anatomy of Frumpy: What Makes an Outfit Look Frumpy (Women 40+)
79,093 reader signals and 102 garment variables scored: the necklines, sleeves, hems, fabrics and shoes that make an outfit read as frumpy, and the fixes.
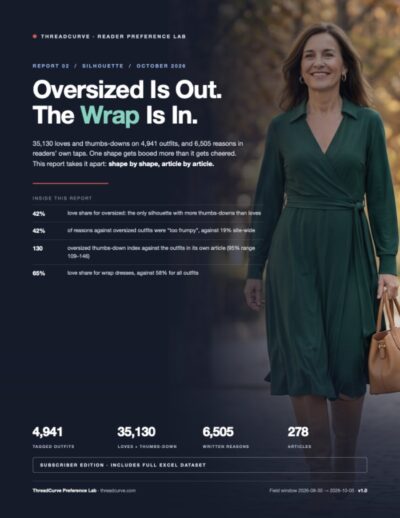
Oversized Is Out, the Wrap Is In: Silhouette Preference Report
35,130 loves and thumbs-downs on 4,941 outfits: why oversized is the only silhouette readers boo more than they cheer, and why wrap wins.
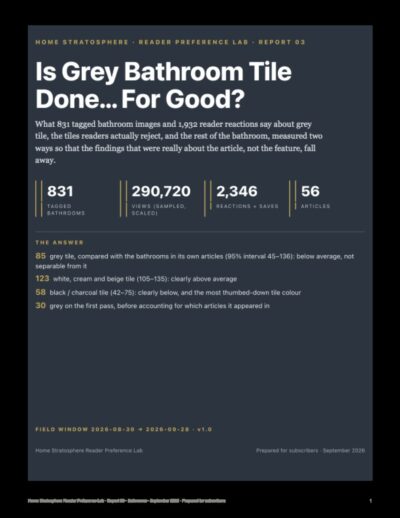
Is Grey Bathroom Tile Done? Bathroom Preference Report 2026
831 tagged bathrooms and 290,720 views: grey tile, the tile colours readers actually reject, and every other bathroom feature, measured fairly.
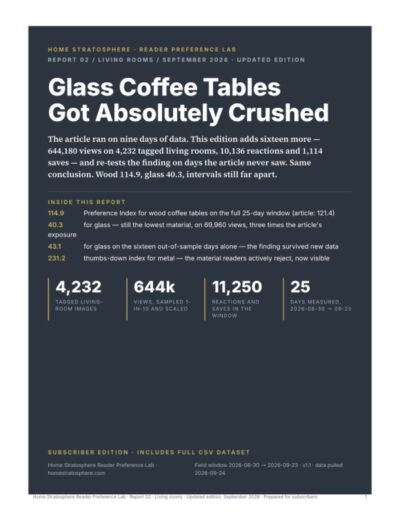
Glass Coffee Tables Got Crushed: Coffee Table Preference Index
644,180 views of 4,232 living rooms: wood coffee tables index 114.9, glass 40.3, and the finding held on 16 days of new data.
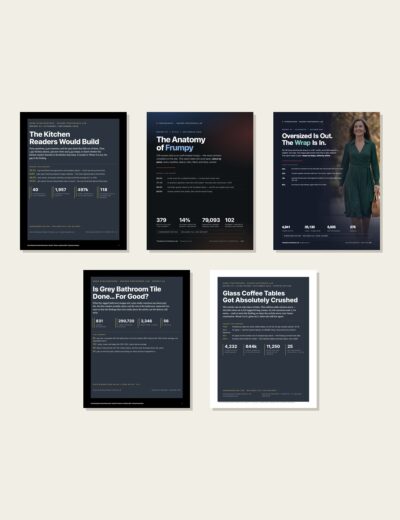
Complete Library: All Statwren Reports
All five Statwren reports, home and fashion, with every dataset. Save US$226.
Why it is different
Behaviour first, then what people say
Signals, not recall
Surveys ask people to predict their own taste. We record what readers do when nobody is asking: what they save, what they thumb down, which of two images they pick.
Say versus do
Where we run polls, we check the answer against behaviour on the same topic. When the two disagree, the gap is usually the most valuable finding in the report.
Honest about the limits
Every index carries a 95% interval and a reporting threshold. Every report states who the panel is and what it cannot tell you. Findings that fall apart under a fair comparison are shown falling apart.
Coverage
Industries
Two categories are live. The panel already collects signals in the rest, and reports will follow as sample sizes clear our reporting thresholds.
Custom research
Need an answer we have not published?
We can put your question in front of the panel: a poll series, a head-to-head image test or a tagged-image study on your category. You get a private report and the data.