The Everyday Table Report: 903 Photos of Old-Fashioned Dinners, Lunches and Potlucks, Judged
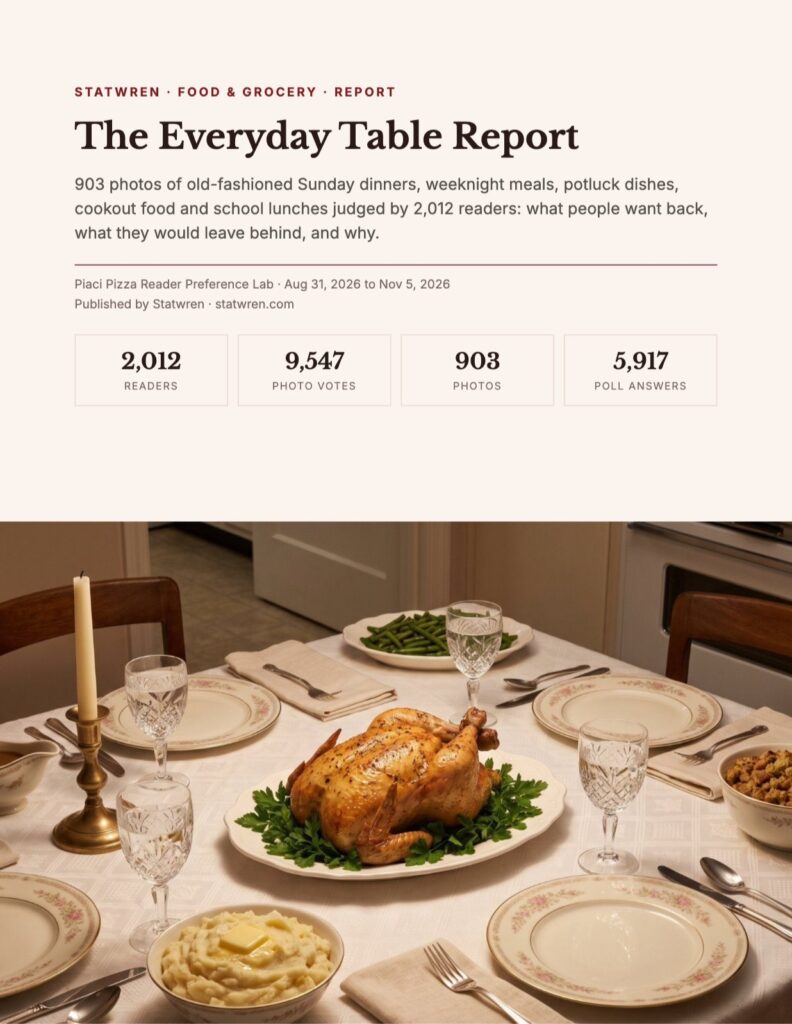
Report · 31-page PDF + Excel workbook
2,012 readers cast 9,547 votes on 903 photos of old-fashioned Sunday dinners, weeknight meals, potluck dishes, cookout food and school lunches, plus 5,917 poll answers: what people want back, what they would leave behind, and why.
- Instant download after checkout
- Licensed for use across your company
- Every figure reproducible from the data
Which everyday dishes do food-nostalgia readers still want? This report scores 903 photos of old-fashioned everyday food, pools them by course, era, serving style, look and cuisine, adjusts for each article’s tone with a same-article index, and sets it beside 27 polls on dinner, cooking, shopping and hosting. A companion to the Holiday Table Report.
Key findings
- 78% of 9,547 votes on old-fashioned everyday food were hearts.
- 83% for casseroles, level with soups and sides; salads drew 53%, the only course readers split on.
- 85% / 73% for rustic, homemade-looking food against retro-styled food; 70% pick a rustic plate over a restaurant-polished one in the polls.
- 66% would rather eat a 1970s classic than today’s dinner; 61% say home cooking was better in the 1970s.
What’s inside
- 31-page PDF report
- Everyday dishes pooled by course, era, serving style, look and cuisine, with 95% ranges and a same-article index
- The most-loved dishes and the ones readers would leave behind
- Why readers loved or rejected a dish, and 27 polls on dinner, cooking, shopping and hosting
- What it means for the trade: packaged-food and grocery brands, restaurants and meal kits, food media
- Dataset: Excel workbook (every photo with its traits, pooled traits, articles, reasons, polls)
Sample and method
| Panel | Readers of piacipizza.com, a US food-nostalgia publication |
|---|---|
| Field window | Aug 31 to Nov 5, 2026 |
| Signals | 9,547 photo votes from 2,012 readers; 703 reason taps; 5,917 poll answers |
| Format | PDF + XLSX, instant download |
Readers judged photos, not the food itself. 100% of votes came from the US and 88% from phones; age and gender are not recorded. It is not a national sample.
Who uses this
Packaged-food, frozen and grocery brands, meal-kit companies, restaurant and diner menu planners, and food media and recipe publishers.